Urban Weather Prairies – Symphonic Studies by Nathalie Miebach
This installation art work is made by Nathelie Miebach in 2011. Nathalie Miebach’s is a sculptor who focuses on the intersection of art and science and the visual articulation of scientific observations.
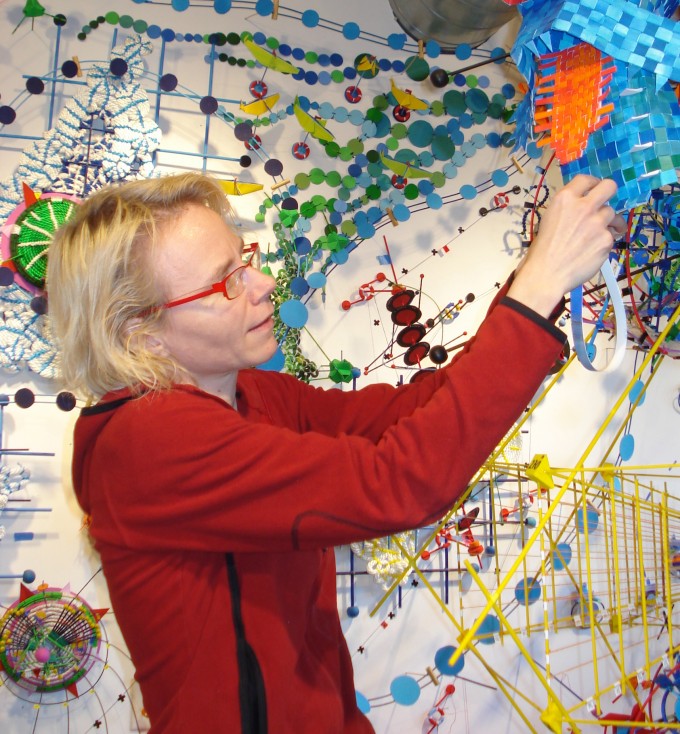
In Urban Weather Prairies, Nathalie Miebach translates weather data collected from weather stations and by her own daily observations collected from a specific environment by using wind speed collector, thermometer etc into a sculpture . She collected data like air temperature, barometric pressure, and wave height etc and translate them into a three-dimensional vibrant, whimsical sculptures, it is about 16’ x 15’ x 15’ large and published in 2011. Not just the sculpture itself has meaning, but where this artwork place also has its own meaning, the wall space uses the rectangle as varies maps of Nebraska or urban centers of Nebraska.
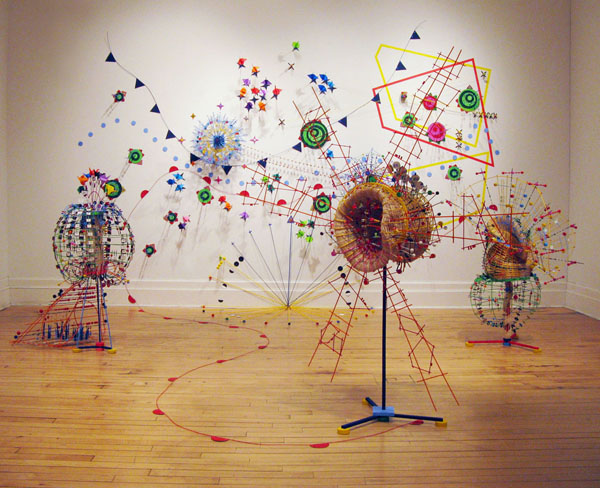
Urban Weather Prairies – Symphonic Studies
Reed, wood, data, 16’x15’x15’, 2009
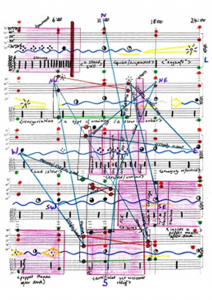
 She also translate the same set of weather data into musical scores, musical notation helps artist had a better understanding on these nuanced weather in another way and being a source. Every color dot and lines represent a weather and constructed this musical score. For example, red dot represent the temperature, green dot represent the barometric pressure, blue curve line represent the cloud cover etc. And she uses these scores to collaborate with musicians. So, the sculptures actually can not only interpret as simply a sculpture, but also a musical score which can be present by musicians
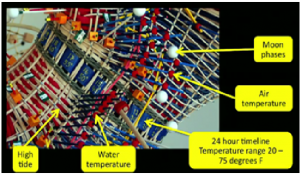
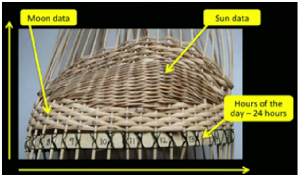
Her main method and format of data translation is by intensive basket weaving and the medium are basket, reed and wood which functions as a simple, tactile grid through which to interpret scientific data into visually three-dimensional space. She first assigned values into the horizontal and vertical elements in the basket, like the horizontal lines represent the hours of the day, the vertical lines represents the moon data, then use changes of the data point to create the art work. Then she install beads, stall, wood in the basket and every color beads and string represent a weather element, like the red bread represent the air temperature, the white beads represent moon phases, the wood represent high tide etc.
This artwork is very innovative and explores a new way to see the world, weather is inherently invisible to people, but the artist could uses a visible way sculpture and music to make it, not just visible, but also tactile and audible. It is actually combining real life data and elements around us in the artwork, the shape of artwork is entirely controlled by the weathered data, what the artist control is the medium used in this artwork. We can understand the data not just in a traditional way by simply looking at numbers and charts but in a visual way showing by a sculpture, or even listen to music which translated by the same set of weather data. We may not fully understand the weather data behind the sculpture, but what more important is how the artist present the art work, like using what medium and the idea of presenting the meaning of sculpture. We may not think of the invisible weather could presented in a seeable and beautiful way.
This artwork is quite fascinating and enchanting not only because the outlook, the colorful elements etc, but also the implicit meaning and the effort the artist paid trying to included three field, the art, science and music together in an artwork. It assembles three elements, it can be art; it can be set of data, it can be a musical score. When we appreciating the beauty and complexity like the shape, materials used, the placement of the artwork etc and put it in a museum for watching, it is an artwork; when we focus on the weather data the artwork present, it can be used as instruments of the data originated and belongs to science field; when we treat it as a musical score and can be presented by musical instruments, it belongs to music area. So this artwork is actually combining three areas together, art, science and music. And challenge our assumption on these area, whether this artwork should belongs to art, belongs to science, or belongs to music. It is not just simply an object, but the artists also want to guide us think more about the definition and the elements of these three area.
This artwork just inspire me of thinking one more step on everything. Nathelie demonstrates a good example of anything could be art, even a set of weather data, an invisible weather condition could still presented in a creative way, the key is whether we have tried to think more and think out of the box.It not only giving us visual effect when we looking at it, but also give us room to reflect after the exhibition. It is a really meaningful work.


